
Archived Content
Information identified as archived is provided for reference, research or recordkeeping purposes. It is not subject to the Government of Canada Web Standards and has not been altered or updated since it was archived. Please contact us to request a format other than those available.
Appendix E4 ver. 1
ACCURACY STANDARD FOR LEGAL SURVEYS
Table of Contents
- Survey Instructions Home
-
Part B - Agreements
-
B2 - Intergovernmental Agreements
-
Part D - Survey Standards
- D1 - Official Surveys
- D2 - Explanatory Plans
- D3 - Strata Surveys
- D4 - Condominium Surveys
- D5 - Registration and Land Use Area Plans
- D6 - Oil and Gas Surveys in Indian Reserves
- D7 - Oil and Gas Surveys in the Territories and Offshore
- D8 - Mineral Claim Surveys in the Northwest Territories and Nunavut
- D9 - Mineral Claim Surveys in Yukon
- D10 - Field Monitoring of Exterior Boundaries and Interior Frameworks
- D11 - Boundary Maintenance
- D12 - Control Surveys
- D13 - Basemapping
- D14 - Land Descriptions
- D15 - Survey Reports
- D16 - As-built Surveys
- D17 - Guidelines for the preparation of Legal Description Reports for the Individual First Nation Agreement under the First Nations Land Management Act
-
Part E - Appendices
Effective Date
This Chapter is effective January 1, 1997. It was originally published as Chapter E4 of the Third Edition of the Manual of Instructions for the Surveys of Canada Lands.
Chapter Sections
- General
- Concept of Confidence Region for Legal Surveys
- Development of Accuracy Standard for legal surveys of Canada Lands
- Application
General
- This appendix gives a brief background on the concept of confidence region, gives reasons to justify the use of the concept for legal surveys and outlines the method used to develop the semi-major axis of the ellipse bounding the 95% confidence region as the accuracy standard for legal surveys.
- The concept of confidence region has been used for control surveys for several years. It was introduced in 1973 by the Surveys and Mapping Branch, Energy Mines and Resources, Canada, in the publication Specifications and Recommendations for Control Surveys and Survey Markers. In 1978, the concept was extended to cover short lines.
- An explanation of the concept of confidence region can be found in Appendix A of Specifications and Recommendations for Control Surveys and Survey Markers (1978 Edition) issued by Geodetic Surveys Division, Geomatics Canada, Ottawa.
Concept of Confidence Region for Legal Surveys
- Even though the concept of confidence region was extended to cover short lines it has not been used to any great extent for legal surveys on Canada Lands. Legal surveys normally do not have sufficient redundant measurements for a good statistical analysis and do not require the accuracy and reliability of measurements required for control surveys. In a legal survey, monuments define boundaries - not measurements.
- The ratio of the error of closure to the length of the traverse
(e. g. 1: 5,000) has traditionally been used to determine the accuracy of legal survey work. This ratio has limitations for very large surveys and surveys involving very short lines. For a very long survey traverse, the allowable error may be misleading and, in some cases, may conceal a blunder. For a 100 m measurement it can be difficult to meet a 1: 5000 error of closure specification. - The ratio has been useful in indicating the existence of some blunders and has been an indication of the accuracy of the traverse. However there is no guarantee that all measurements are free from blunders or the geometry of the traverse is such that all stations are within a desired relative accuracy to each other.
- Development of land related information systems and geographic information systems has made it necessary to re-evaluate how we deal with legal survey information. Legal surveys are an integral part of land related information systems. When information from several data sets are integrated, the need to know positional accuracy is necessary. It is no longer sufficient to assess accuracy of a legal survey in terms of the ratio of the error of closure to the length of the traverse. The trend is to integrate legal surveys with geodetic control and to rate accuracy in terms of qualified position.
- New technology such as the Global Positioning System (GPS), and evolving surveying methodology, often provides more redundant observations than in the past. The traditional survey traverse provides only two degrees of freedom, whereas GPS and radial surveying techniques readily allow additional observations to strengthen and increase the reliability of surveys.
Development of Accuracy Standard for legal surveys of Canada Lands
- The accuracy standard used for control surveys is defined by the
ellipse showing the 95% confidence region of one station relative to
another in the network. This accuracy standard is also used for legal
surveys on Canada Lands. The semi-major axis (r) of this ellipse must
be less than C( d+ x) where:
- r is expressed in centimetres;
- C is assigned a value depending on the accuracy requirement;
- d is the distance in kilometres to any station; and
- x a constant.
- Two cases are considered: surveys using the surveyor's own
measurements, and surveys using the surveyor's own measurements
combined with the measurements of previous surveys.
- Case 1: Surveys involving only the surveyor's own measurements
- An empirical approach was used to determine C
and x. Using normal legal survey
instrumentation and methods, 2.0 cm was chosen as an upper limit for
an allowable error for a distance of 10 m, and 10.0 cm was chosen as
a limit for a distance of 1000 m. Solving for C
and the constant x, the formula, r = C( d+ x), is solved simultaneously:
- Equation 1 2.0 = C( 0.01 + x)
- Equation 2 10.0 = C( 1.00 + x)
After rounding, C = 8 and x = 0.25.
Therefore r = 8(d+ 0.25).
- The following table illustrates how various distances affect the
semi-major axis of the 95% confidence region of one station with
respect to another in parts per million (ppm) and the accuracy ratio
for r = 8( d+ 0.25);
Accuracy standard d (km) r (cm) ppm ratio 0.01 2.1 2100 1/480 0.03 2.2 733 1/1360 0.10 2.8 280 1/3570 0.50 6.0 120 1/8033 1.00 10.0 100 1/10000 Case 2: Surveys combining the surveyor's own measurements with previous measurements
- An empirical approach was also used to determine C and x; 3.5 cm was
chosen as an upper limit for an allowable error for a distance of 10
m and 18.0 cm was chosen as a limit for a distance of 1000 m. Again
the formula, r = C( d+ x), is solved for
C and constant x.
- Equation 1 3.5 = C( 0.01 + x)
- Equation 2 18.0 = C( 1.00 + x)
After rounding, C = 15 and x = 0.25.
Therefore r = 15( d+ 0.25). - 14. The following table illustrates how various distances affects
the semi-major axis of the 95% confidence region of one station with
respect to another in parts per million (ppm) and the accuracy ratio
for r = 15( d+ 0.25).
Distances d (km) r (cm) ppm ratio 0.01 3.9 3900 1/260 0.03 4.2 1400 1/710 0.10 5.3 530 1/1890 0.50 11.3 225 1/4420 1.00 18.3 190 1/5320
Application
- The ppm or ratios shown in the tables above may be used as a guide
to assess accuracy in the same manner as the previous ratio was used
and will be an indication if the accuracy standard is being met. The
surveyor must note that the connection used in any determination of
accuracy is between all monuments and all traverses stations. The
geometry of the survey assumes a greater degree of importance using
the confidence region approach. Two examples are given.
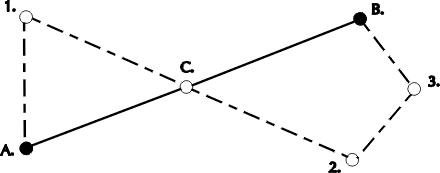
- Example 1: Placing a monument C on a boundary between two monuments A and B. It is assumed that one can not directly observe along the line AB (see figure E4- 1).
-
 Text
description of Figure E4-1
Text
description of Figure E4-1
- Figure E4-1
- The connection used for the determination of accuracy of the boundary survey is the distances AC and BC .
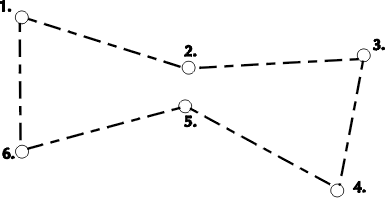
- Example 2: A closed traverse where two stations are close together but have not had a direct survey tie made between them (see figure E4- 2).
-
 Text
description of Figure E4-2 - Closed Traverse
Text
description of Figure E4-2 - Closed Traverse
- Figure E4-2 - Closed Traverse
- The connection 2 to 5 must also meet the accuracy requirements.